
Rahmat Agung Wibowo
Thursday, December 1, 2022 | 2 minutes
Tidy up our Prometheus metrics!
In this article I’ll explain my process of analyzing and setting up Prometheus, where I maybe effectively increase query performance and addressed challenges related to cardinality. FYI, I use this stack on my monitoring system: Grafana, Promethues, Thanos. The metrics itself gethered from several source: node exporter, kube-state-metrics, etc.
1. List unused metrics
Firs, we need to list metrcis that used in our Grafana. To do this task, we can use mimirtool.
$ mimirtool analyze grafana --address=${GRAFANA_URL} --key="${GRAFANA_API_TOKEN}"
In my case, I execute this command:
$ mimirtool analyze grafana --address=https://grafana.rahmatawe.com --key="glsa_jLKvTx6RLkGXXXX6XKS6DXlrulepsy_xxxxx"
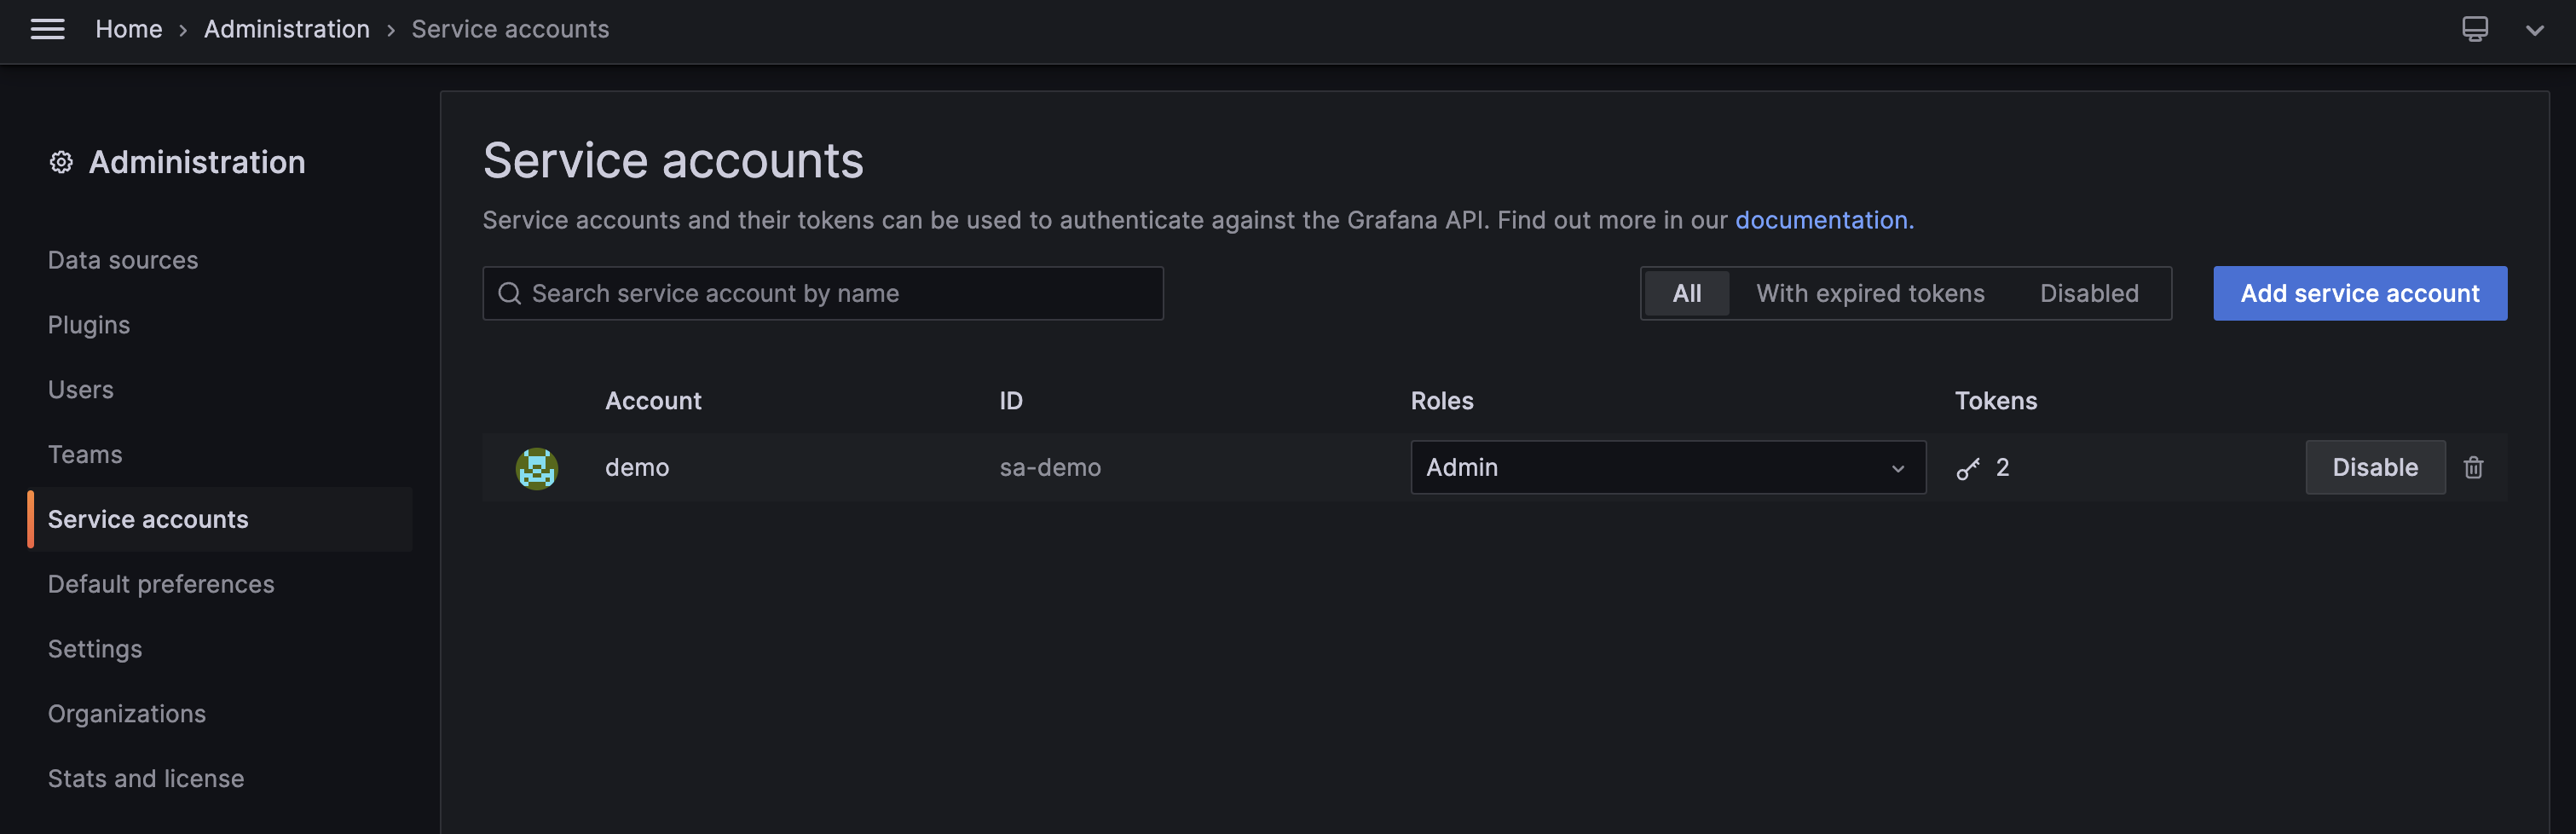
Anw, you can get GRAFANA_API_TOKEN by creating service account on Grafana dashboard.
Above command will generate file named metrics-in-grafana.json. Using this file, we will compare it to metrics stored in Prometheus.
#port forward to prometheus
$ kubectl port-forward prometheus-prometheus-0 9090:9090 -n monitoring

# Compare grafana metrics and prometheus
$ mimirtool analyze prometheus --grafana-metrics-file="metrics-in-grafana.json" --address=http://localhost:9090

INFO[0002] 73815 active series are being used in dashboards
INFO[0002] Found 2495 metric names
INFO[0017] 434700 active series are NOT being used in dashboards
INFO[0017] 467 in use active series metric count
INFO[0017] 2028 not in use active series metric count
NOTE: Adjust prometheus-prometheus-0 with your prometheus pod name and monitoring with namespace where your prometheus pod deployed.
It will generate file prometheus-metrics.json. Sort it.
$ jq -r ".in_use_metric_counts[].metric" prometheus-metrics.json | sort > used_metrics.txt
$ jq -r ".additional_metric_counts[].metric" prometheus-metrics.json | sort > unused_metrics.txt
2. Drop unused metrics
On step 1, we have been list used metrics and unused metrics. Next step, we will check metrics which have high cardinality via Prometheus dashboard http://localhost:9090/tsdb-status.
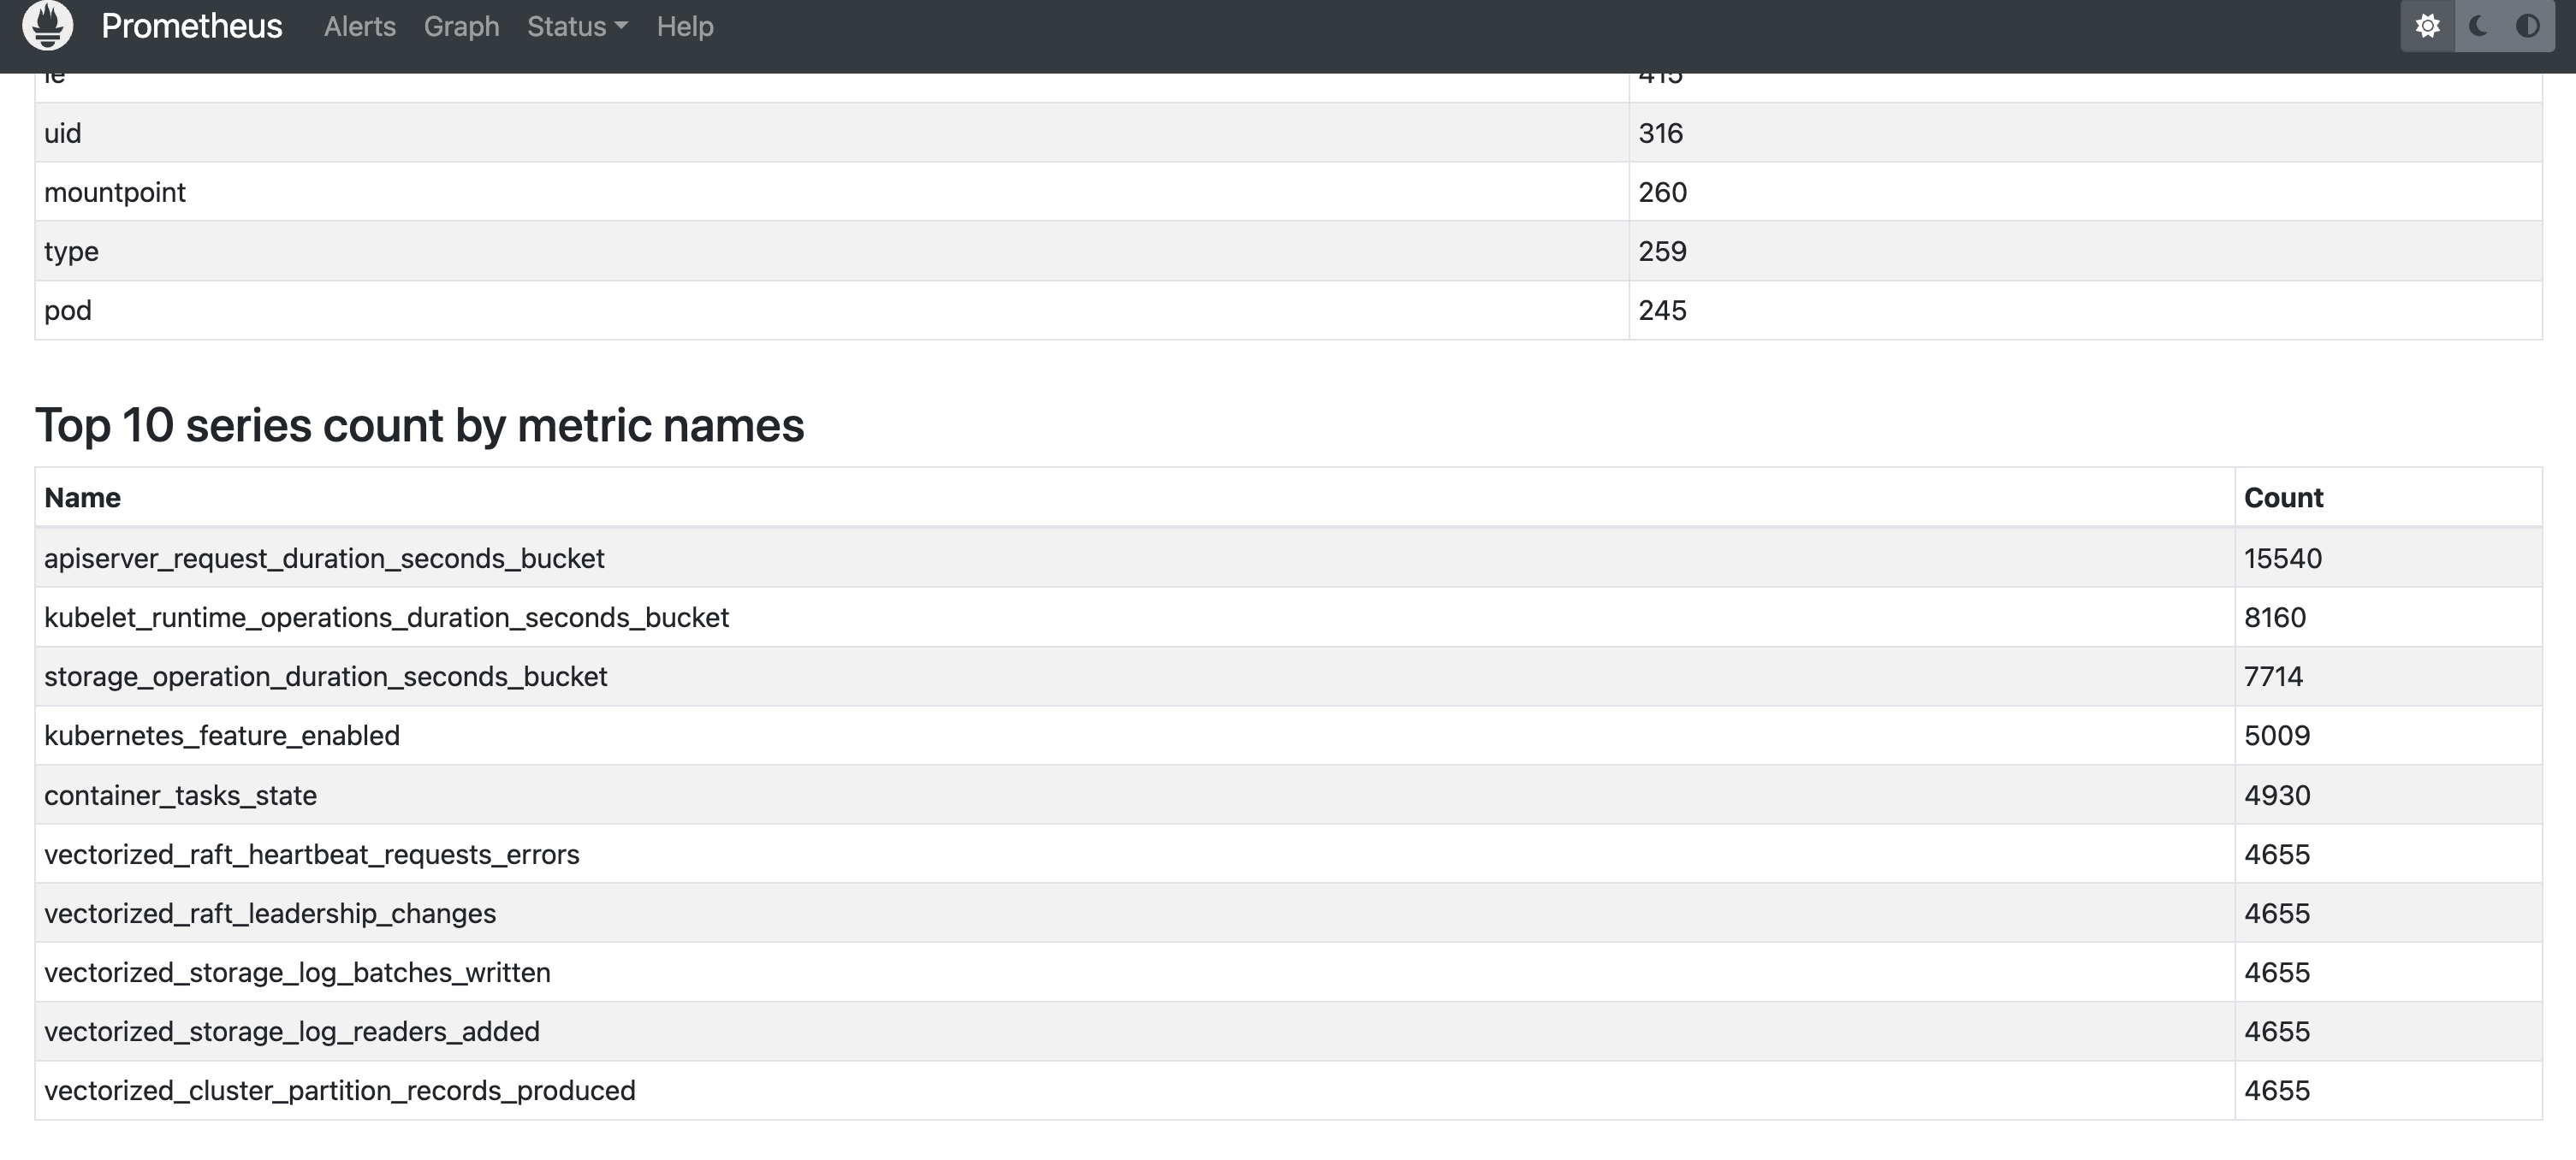
Hmm, let us check metrics apiserver_request_duration_seconds_bucket.
$ grep apiserver_request_duration_seconds_bucket u*_metrics.txt
unused_metrics.txt:apiserver_request_duration_seconds_bucket
We can drop this metrics since it’s not used by Grafana. I will drop it via its ServiceMonitor. You can drop it other method (ex: prometheus config directly) depend on your setup.
---
apiVersion: monitoring.coreos.com/v1
kind: ServiceMonitor
metadata:
  name: kube-apiserver
  namespace: monitoring
  labels:
    prometheus: main
    release: prometheus-operator

...

      metricRelabelings:
      - sourceLabels: ["__name__"]
        regex: 'apiserver_request_duration_seconds_bucket'
        action: drop
That’s it. Simple task to drop your bloated Prometheus metrics. Bye!
Ref: