
Rahmat Agung Wibowo
Friday, April 15, 2022 | 5 minutes
Send Log from Event Viewer on Windows Server 2019 to Grafana Loki
In the realm of server management, the ability to efficiently gather, analyze, and visualize logs is paramount. Windows Server 2019 comes equipped with Event Viewer, a powerful tool for viewing and managing event logs. Grafana Loki, on the other hand, is an open-source logging backend that allows for efficient log aggregation and querying. Integrating Event Viewer logs from Windows Server 2019 into Grafana Loki can significantly enhance the monitoring and troubleshooting capabilities of your infrastructure. This guide will walk you through the process of sending logs from Event Viewer to Grafana Loki for centralized analysis and visualization.
Environment
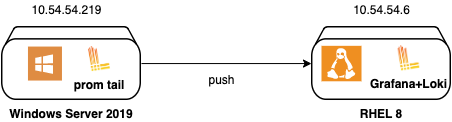
# Servers
ag-rh2 : 10.54.54.6 (Grafana + Loki)
win2k19 : 10.54.54.219 (Promtail)

# OS Packages Release
RHEL 8.4
Windows Server 2019
Loki 2.5
Grafana 8.4.6
Setup Loki
1. Download package Loki
curl -O -L "https://github.com/grafana/loki/releases/download/v2.5.0/loki-linux-amd64.zip"
2. Setup loki binary
# Unzip package
unzip loki-linux-amd64.zip

# Grant execute permission
chmod +x loki-linux-amd64

# Create directory for loki installation
sudo mkdir -p /opt/loki/{bin,conf,data}

# Move loki binary
mv loki-linux-amd64 /opt/loki/bin/loki
3. Setup loki configuration
Default configuration can be retrieved from here. I create loki config on /opt/loki/config/loki-local-config.yaml using below content:
auth_enabled: false

server:
  http_listen_port: 3100

ingester:
  lifecycler:
    address: 127.0.0.1
    ring:
      kvstore:
        store: inmemory
      replication_factor: 1
    final_sleep: 0s
  chunk_idle_period: 1h       # Any chunk not receiving new logs in this time will be flushed
  max_chunk_age: 1h           # All chunks will be flushed when they hit this age, default is 1h
  chunk_target_size: 1048576  # Loki will attempt to build chunks up to 1.5MB, flushing first if chunk_idle_period or max_chunk_age is reached first
  chunk_retain_period: 30s    # Must be greater than index read cache TTL if using an index cache (Default index read cache TTL is 5m)
  max_transfer_retries: 0     # Chunk transfers disabled
  wal:
    dir: /opt/loki/data/wal


schema_config:
  configs:
    - from: 2020-10-24
      store: boltdb-shipper
      object_store: filesystem
      schema: v11
      index:
        prefix: index_
        period: 24h

storage_config:
  boltdb_shipper:
    active_index_directory: /opt/loki/data/boltdb-shipper-active
    cache_location: /opt/loki/data/boltdb-shipper-cache
    cache_ttl: 24h         # Can be increased for faster performance over longer query periods, uses more disk space
    shared_store: filesystem
  filesystem:
    directory: /opt/loki/data/chunks

compactor:
  working_directory: /opt/loki/data/boltdb-shipper-compactor
  shared_store: filesystem
  compaction_interval: 10m
  retention_enabled: true
  retention_delete_delay: 2h
  retention_delete_worker_count: 150

limits_config:
  reject_old_samples: true
  reject_old_samples_max_age: 168h

chunk_store_config:
  max_look_back_period: 0s

table_manager:
  retention_deletes_enabled: true
  retention_period: 30d

ruler:
  storage:
    type: local
    local:
      directory: /opt/loki/data/rules
  rule_path: /opt/loki/data/rules-temp
  alertmanager_url: http://localhost:9093
  ring:
    kvstore:
      store: inmemory
  enable_api: true

analytics:
  reporting_enabled: false
On above configuration, there is configuration for alertmanager but we will not include alertmanager installation in this post.
4. Create system user for loki
sudo useradd --system loki
5. Change permission on loki directory
# Change ownership
sudo chown -R loki:loki /opt/loki

# Restore SELinux label
sudo restorecon -vRF /opt/loki/
6. Run loki service on systemd
First, create systemd file for loki on /etc/systemd/system/loki.service. Paste below content.
[Unit]
Description=Loki service
After=network.target

[Service]
Type=simple
User=loki
ExecStart=/opt/loki/bin/loki -config.file /opt/loki/conf/loki-local-config.yaml
Restart=always

[Install]
WantedBy=multi-user.target
Then, run loki service.
sudo systemctl enable --now loki.service
7. Open port for loki service
sudo firewall-cmd --add-port 3100/tcp --permanent
sudo firewall-cmd --reload
Setup Grafana
1. Download Grafana RPM package
curl -O -L https://dl.grafana.com/oss/release/grafana-8.4.6-1.x86_64.rpm
2. Install package
sudo yum localinstall grafana-8.4.6-1.x86_64.rpm
3. Start grafana service
sudo systemctl enable --now grafana-server.service
4. Open port for grafana service
sudo firewall-cmd --add-port 3000/tcp --permanent
sudo firewall-cmd --reload
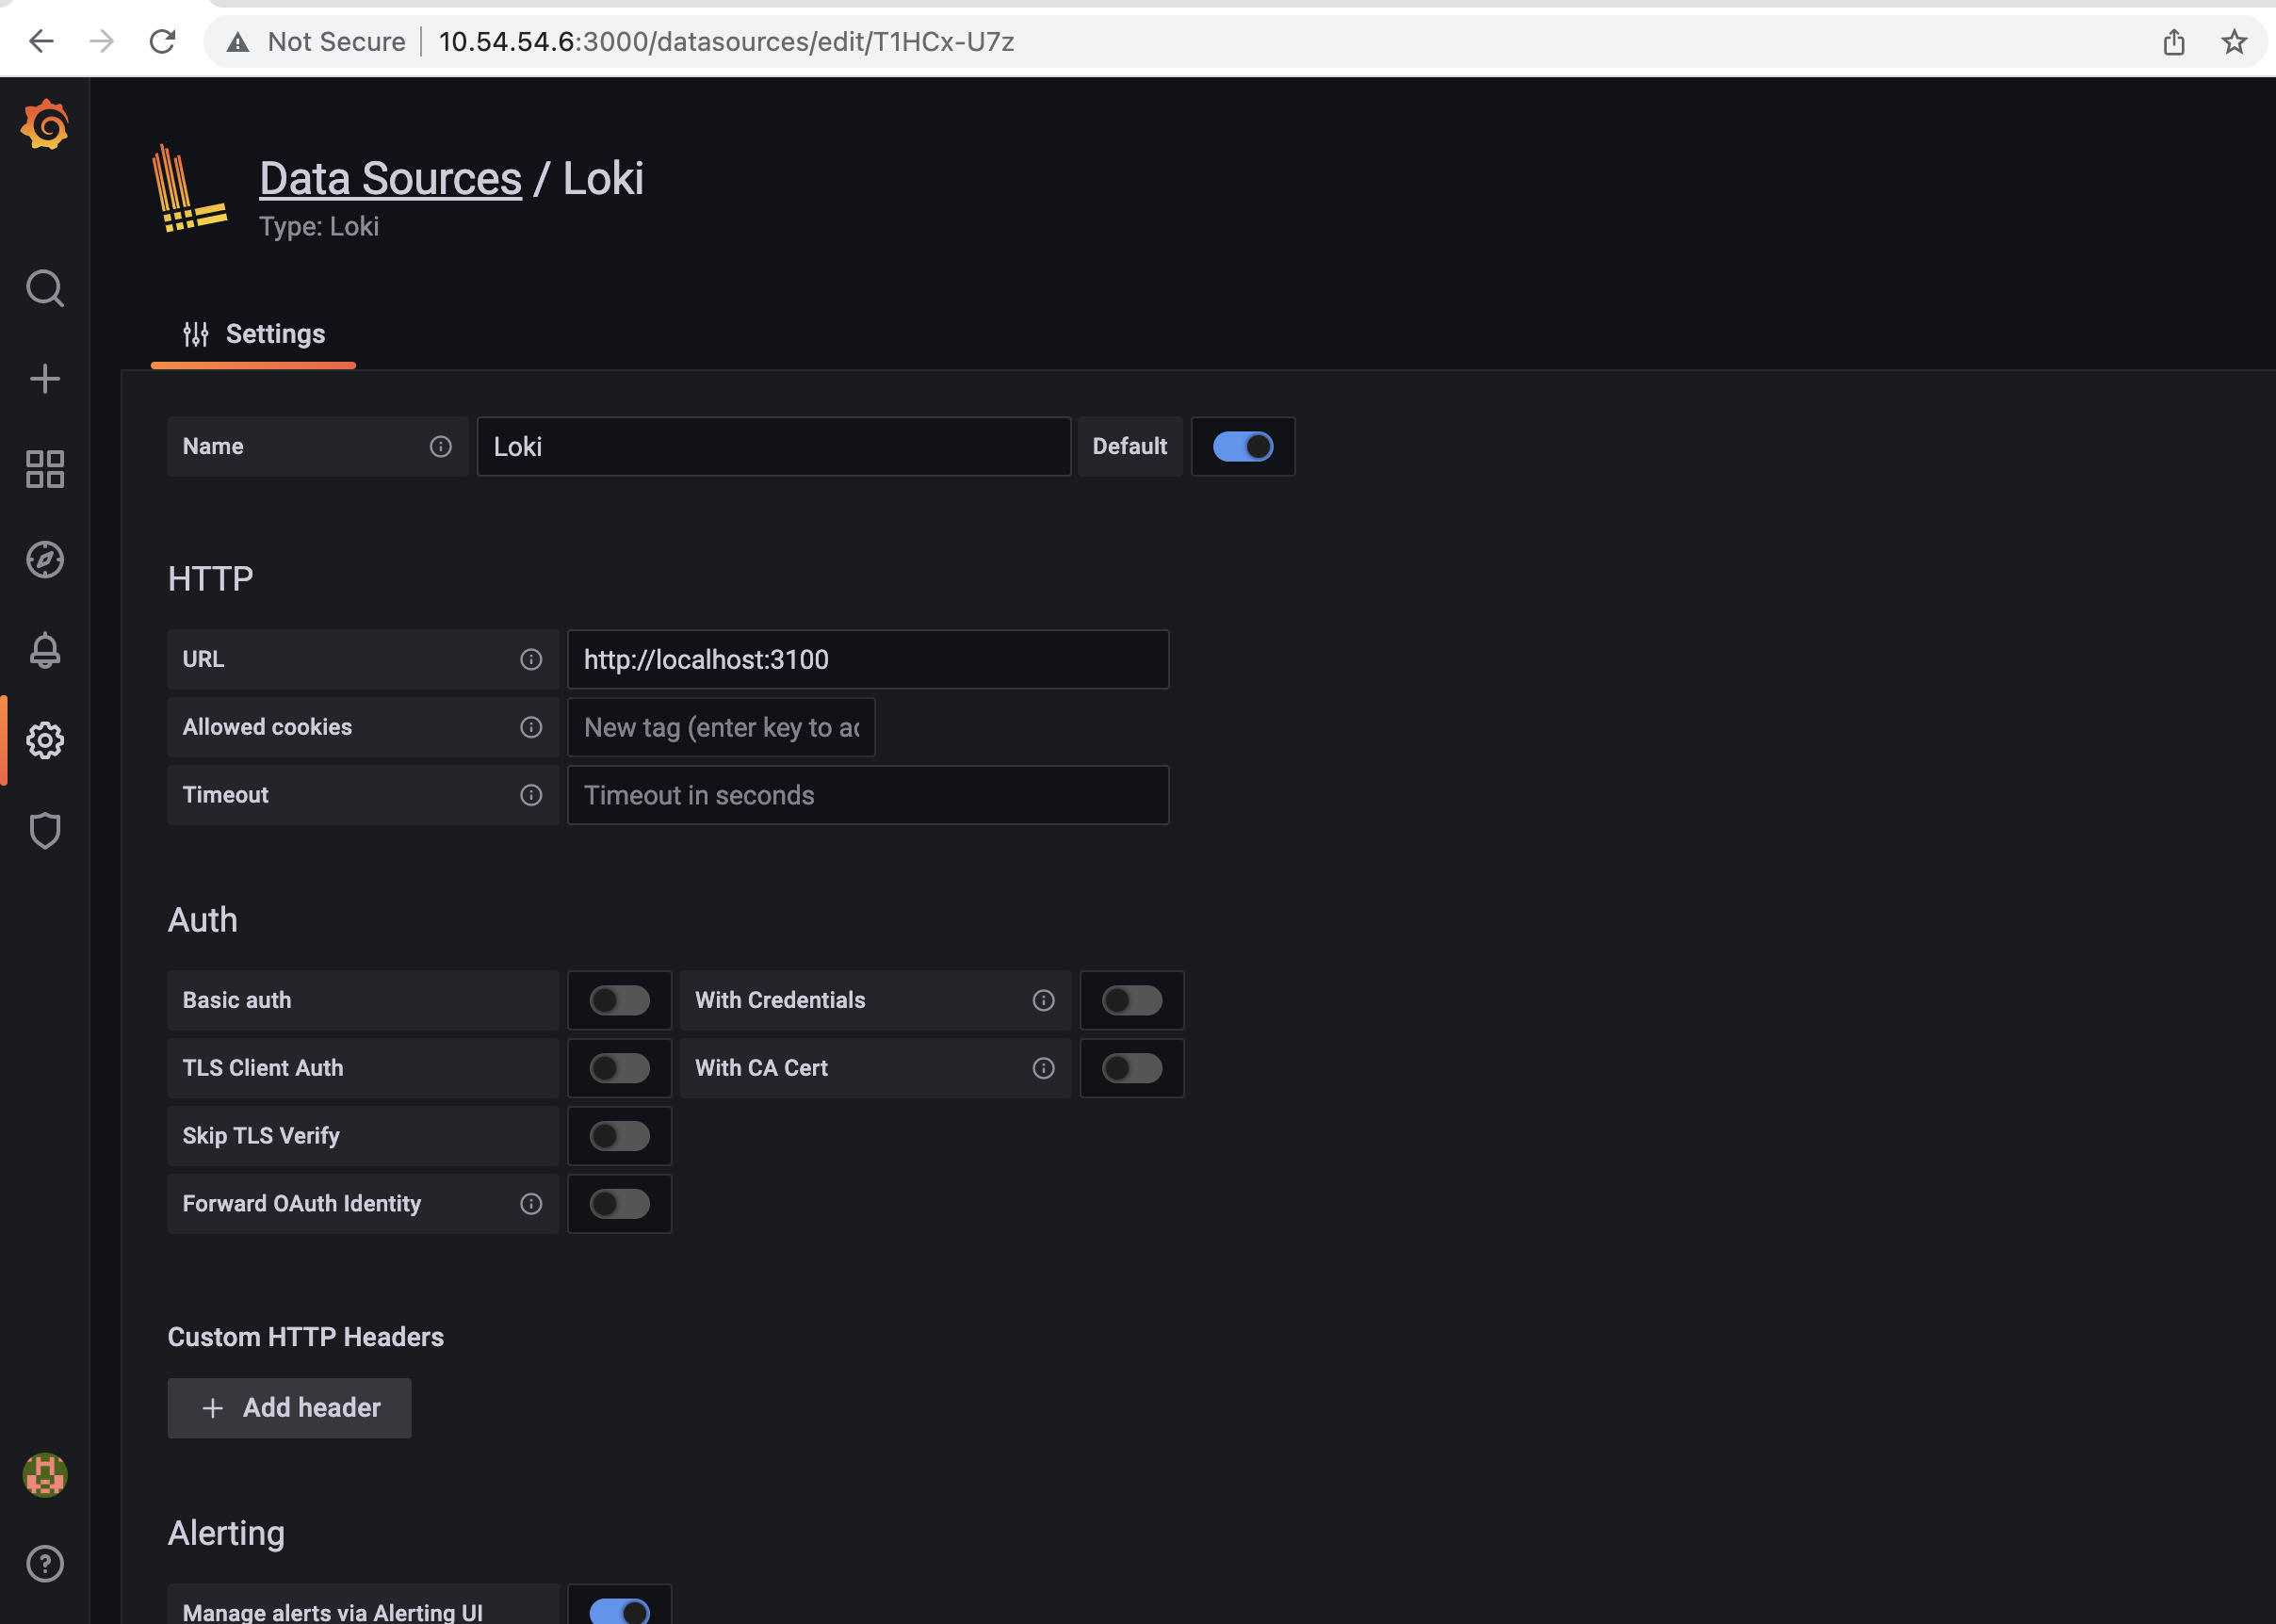
5. Add Loki datasource to Grafana.
Open grafana URL on 10.54.54.6:3000 then add Loki as datasource.
Setup Promtail
1. Download promtail binary
To collect log from vent Viewer on Windows Server, we need to setup promtail. Binary file can be downloaded in here. Move the exctracted file to C:\Program Files\promtail, see below for detail.
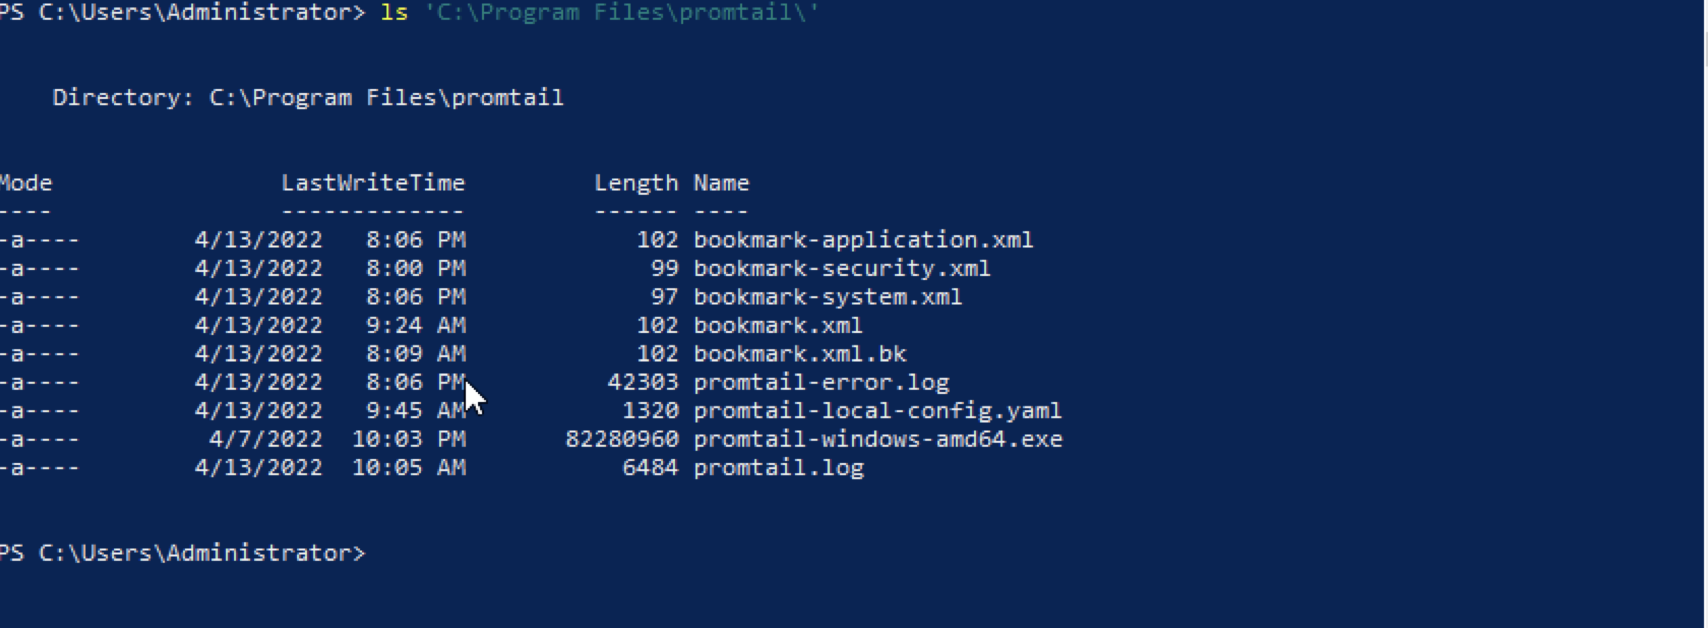 For new installation, it should be contain only the binary file
 promtail-windows-amd64.exe.
2. Create promtail configuration
Create promtail configuration file promtail-local-config.yaml with following content.
server:
  http_listen_port: 9080
  grpc_listen_port: 0

clients:
  - url: http://10.54.54.6:3100/loki/api/v1/push

scrape_configs:
  - job_name: windows-application
    windows_events:
      eventlog_name: "Application"
      xpath_query: "*[System[(Level=1 or Level=2 or Level=3)]]" # Critical, Error, Warning
      labels:
        logsource: windows-eventlog
      use_incoming_timestamp: true
      bookmark_path: "./bookmark-application.xml"
      exclude_event_data: true
    pipeline_stages:
    - json:
        expressions:
          level: levelText
    - labels:
        level:
    relabel_configs:
      - source_labels: ['computer']
        target_label: 'host'
  - job_name: windows-security
    windows_events:
      eventlog_name: "Security"
      xpath_query: "*[System[(Level=1 or Level=2 or Level=3)]]"
      labels:
        logsource: windows-eventlog
      use_incoming_timestamp: true
      bookmark_path: "./bookmark-security.xml"
      exclude_event_data: true
      exclude_user_data: true
    pipeline_stages:
    - json:
        expressions:
          level: levelText
    - labels:
        level:
    relabel_configs:
      - source_labels: ['computer']
        target_label: 'host'
  - job_name: windows-system
    windows_events:
      eventlog_name: "System"
      xpath_query: "*[System[(Level=1 or Level=2 or Level=3)]]"
      labels:
        logsource: windows-eventlog
      use_incoming_timestamp: true
      bookmark_path: "./bookmark-system.xml"
      exclude_event_data: true
      exclude_user_data: true
    pipeline_stages:
    - json:
        expressions:
          level: levelText
    - labels:
        level:
    relabel_configs:
      - source_labels: ['computer']
        target_label: 'host'
3. Test promtail
Test the configuration by running promtail directly via Powershell. Use Ctrl+C to stop program.
& 'C:\Program Files\promtail\promtail-windows-amd64.exe' --config.file='C:\Program Files\promtail\promtail-local-config.yaml'
4. Run promtail using windows service wrapper.
There are some service wrapper on Windows, for example: sc.exe, nssm.exe and winsw. Windows has built in service wrapper: sc.exe, but when I use sc.exe to run promtail it always return error: StartService FAILED 1053. I’m not really familiar with Windows Server, so still figuring out why this error appear. So, I use nssm to wrap my promtail. You only need to download, unzip it and run below command.
.\nssm.exe install promtail
Boom, GUI windows will appear. Set the setting like below.
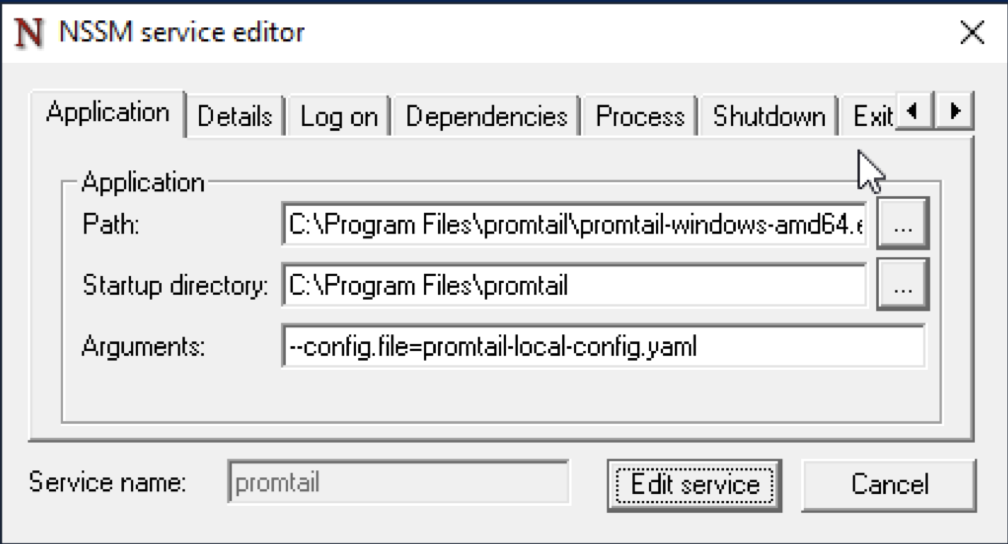 You can also bypass the GUI, with
 .\nssm install <servicename> <application> [<options>].
After service created, configure log file.
.\nssm.exe set promtail AppStderr 'C:\Program Files\promtail\promtail-error.log'
.\nssm.exe set promtail AppStdout 'C:\Program Files\promtail\promtail.log'
Then, start the service.
.\nssm.exe start promtail
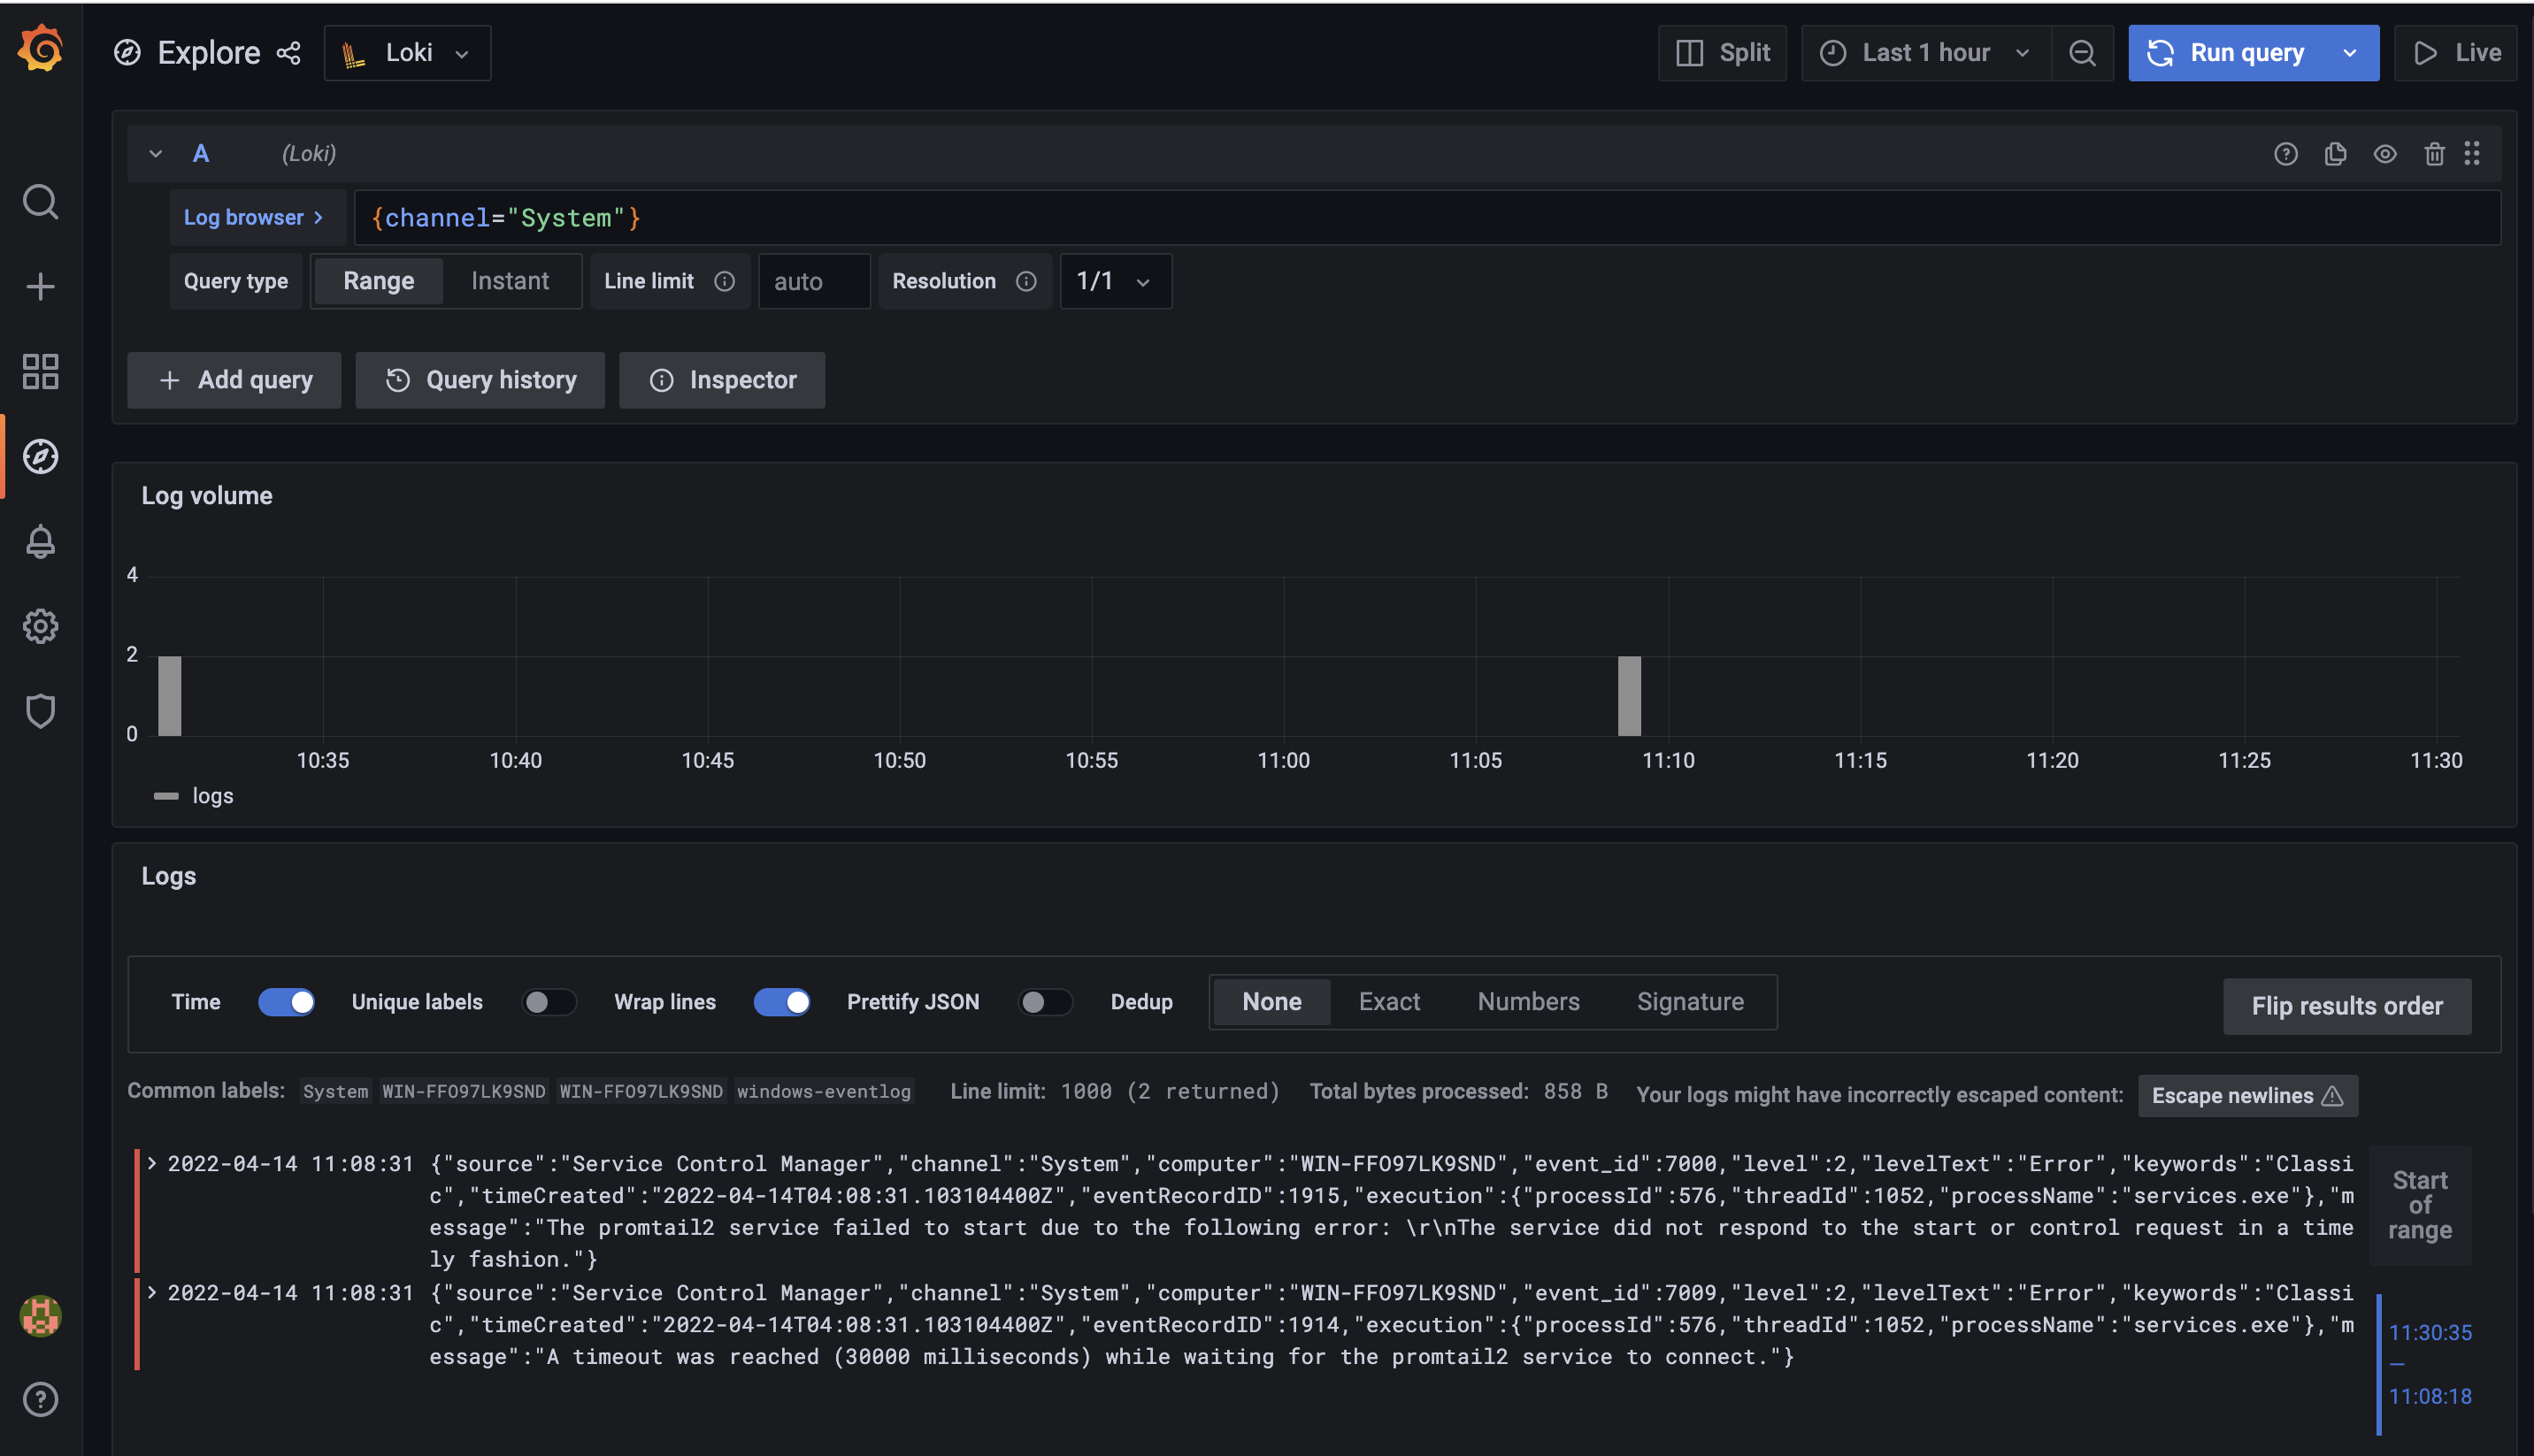
5. Open Grafana to check incoming logs
References:
Grafana Loki Storage Retention
Log Scrapping made Easy with Grafana Loki in Windows